Ashwin Parulkar, AVP, Research, HELP USA
Kevin Lin[1], Case Manager, New York State Unified Court System
Over the past two decades, overdose deaths have increasingly shaped mortality trends among persons experiencing homelessness (PEHs) in New York City. Total deaths among PEHs rose from 162 in FY06 to 770 in FY24—a 375% increase (Table 3). Overdose deaths grew at more than twice that rate, from 38 to 348, an 815% increase.
Recent years reflect both encouraging progress among the sheltered population and serious challenges among the non-sheltered population.
Among sheltered PEHs, overdose deaths declined by 37% between FY22 and FY24, falling from 258 to 162. This reduction is notable given the rapid expansion of the sheltered population, which grew by 138% during the same period—from 59,550 in July 2021 to 141,685 in June 2024 (Table 1). This growth, largely driven by newly arrived migrants, led the city to delegate shelter management responsibilities to additional agencies, including HERRCS.
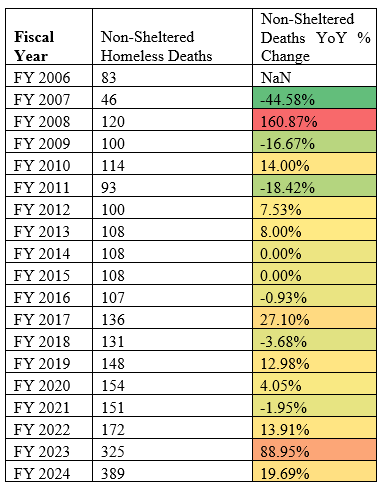
In contrast, overdose deaths among non-sheltered PEHs surged by 160%, from 71 to 186 between FY22 and FY24. This trend is particularly alarming given the relatively small size of the non-sheltered population. According to the 2024 federal Point-in-Time (PIT) count, 4,140 individuals were non-sheltered—a 17% increase from 2022 (DHS, 2022, 2024).
Table 1: Sheltered population counts (July 2021 and June 2024)
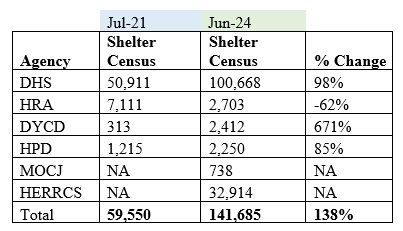
Source: City Limits Homeless Shelter Tracker https://citylimits.org/homeless-shelter-tracker/
Consequently, overdose deaths among all PEHs rose by 6% from FY22 to FY24, from 329 to 348. In FY24 overdose also remained the leading cause of death among PEHs for the eleventh consecutive year, accounting for 45.2% of all deaths—42.5% among sheltered and 47.8% among non-sheltered individuals. The gap between overdose and other leading causes, such as heart disease, continues to widen.
The persistence of overdose as the dominant cause of death—despite significant reductions among the largest subgroup—raises a critical question: To what extent have overdose deaths among key subpopulations contributed to the overall increase in total deaths from FY06 to FY24?
Table 2: Demographic profiles of PEH decedents FY ’06-‘24
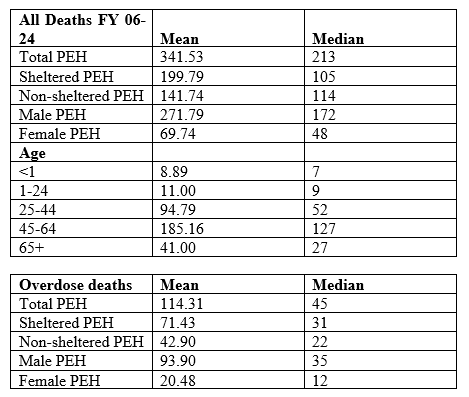
Source: New York City Department of Health and Mental Hygiene (DOHMH) & Department of Homeless Services (DHS) Annual Reports on Homeless Deaths (FY06-FY24)
Interpretation and Implications
The mean number of total and overdose deaths among PEHs and their subpopulations is significantly higher than the median over the study period (see Table 2). This suggests a “right-skewed” distribution driven by high-death years. Indeed, the distribution of both total and overdose deaths among PEHs is largely driven by sharp increases in deaths beginning in 2021 (see Table 3).
This pattern calls for analysis of when and how rising overdose deaths among subpopulations have shaped the distribution of leading causes of death – the proportional mortality rates – and the overall number of deaths in the PEH population.
Although the recent 37% decline in overdose deaths among sheltered PEHs is encouraging, it must be viewed in the context of longer-term trends. The steep rise in overdose deaths in the years preceding this decline suggests that more ambitious reduction targets are needed.
However, this analysis is constrained by the available DOHMH data, which only provides proportional mortality rates disaggregated by shelter status and gender. More granular data would be essential to fully understand patterns across other key subpopulations, such as racial groups.
Table 3: Total PEH deaths and Overdose deaths
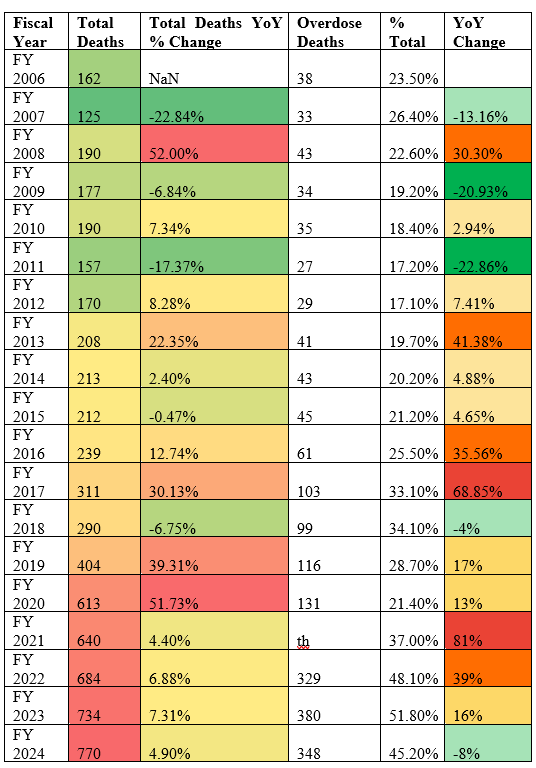
Source: New York City Department of Health and Mental Hygiene (DOHMH) & Department of Homeless Services (DHS) Annual Reports on Homeless Deaths (FY06-FY24)
Overdose Deaths Among PEHs: Trends and Turning Points (2016–2024)
In 2017, overdose deaths among persons experiencing homelessness (PEHs) surged by 69% compared to 2016. This spike coincided with the largest recorded increases in the proportion of overdose deaths relative to total PEH deaths and to male PEH deaths since overdose became the leading cause of death in FY2014. That year also marked only the second time in the study period when deaths among sheltered PEHs (175) exceeded those among non-sheltered PEHs (136) (see Tables 4 and 5).
Table 4: Sheltered deaths
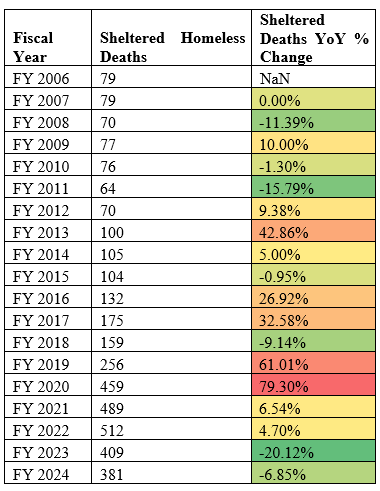
Source: New York City Department of Health and Mental Hygiene (DOHMH) & Department of Homeless Services (DHS) Annual Reports on Homeless Deaths (FY06-FY24)
Table 5: Non-sheltered deaths
Source: New York City Department of Health and Mental Hygiene (DOHMH) & Department of Homeless Services (DHS) Annual Reports on Homeless Deaths (FY06-FY24)
Among sheltered PEHs, overdose deaths rose from 39 in 2016 to 64 in 2017—a 64% increase—raising their share of deaths in this subgroup from 30% to 37%. Meanwhile, heart disease (the second leading cause) declined from 22% to 19% (Figure 1). Overdose deaths were increasingly concentrated among sheltered individuals.
Figure 1: Leading Causes of Death (proportional mortality rates): Sheltered & Non-sheltered PEH
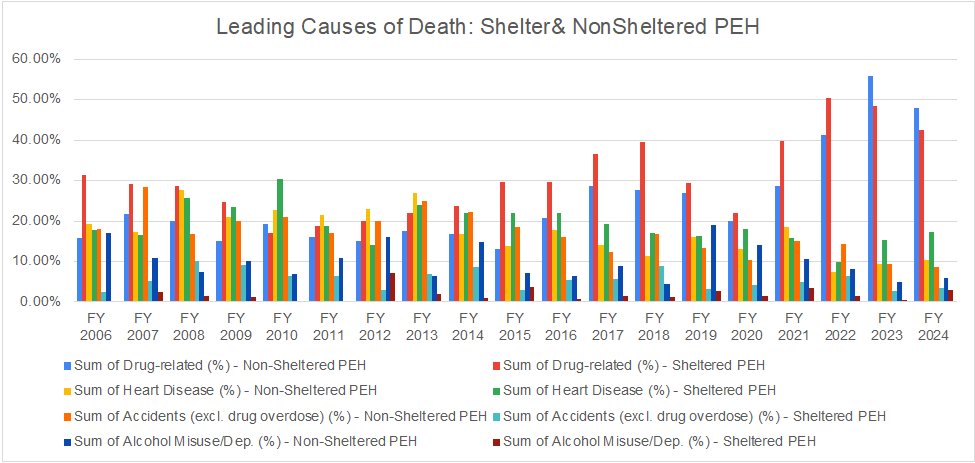
Source: New York City Department of Health and Mental Hygiene (DOHMH) & Department of Homeless Services (DHS) Annual Reports on Homeless Deaths (FY06-FY24)
Among male PEHs, overdose deaths jumped 89%, from 45 to 85 (Figure 2). Their share of overdose deaths rose from 25% to 35%, while heart disease declined from 21% to 19%. These shifts suggest that 2017 marked the onset of the overdose crisis among PEHs, particularly men. Despite these proportional increases, the absolute number of overdose deaths in 2017 remained below the long-term average for all subpopulations.
Figure 2: Leading Causes of Death (proportional mortality rates): Males
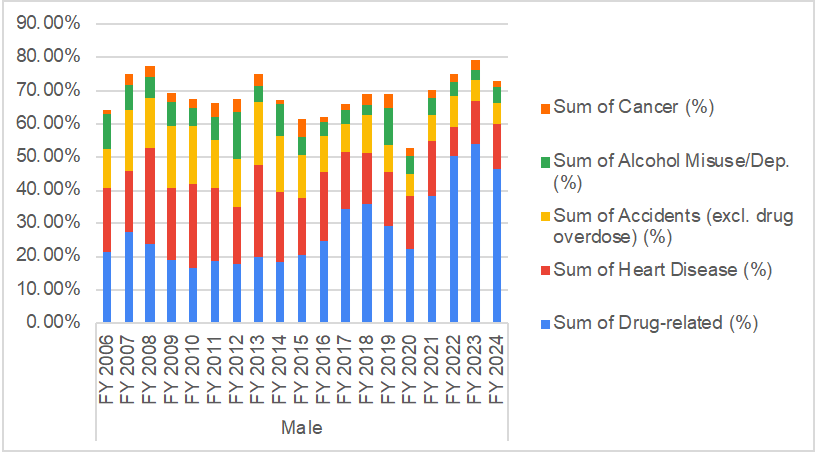
Source: New York City Department of Health and Mental Hygiene (DOHMH) & Department of Homeless Services (DHS) Annual Reports on Homeless Deaths (FY06-FY24)
In 2018, overdose deaths declined slightly (–4%) but began rising again in 2019. Between 2018 and 2019, total PEH deaths increased 39%, from 290 to 404, driven primarily by a 61% rise in sheltered PEH deaths (from 159 to 256). Non-sheltered deaths increased modestly, from 141 to 148.
Figure 3: Leading Causes of Death (proportional mortality rates): Females
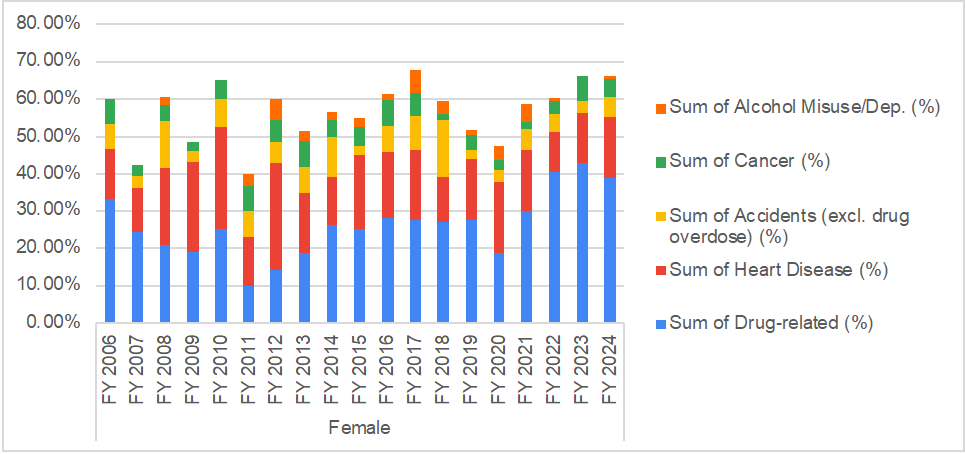
Source: New York City Department of Health and Mental Hygiene (DOHMH) & Department of Homeless Services (DHS) Annual Reports on Homeless Deaths (FY06-FY24)
Overdose deaths among sheltered PEHs increased by 19%, from 63 to 75, and among male PEHs by 10%, from 83 to 91. However, the share of overdose deaths among sheltered PEHs declined from 40% to 29%. This decline was partly due to increases in deaths from unverifiable causes, which rose from 9% to 14%, and deaths from diabetes, which rose from 2% to 5%.
Alcohol-related deaths also increased significantly. Among non-sheltered PEHs, alcohol-related deaths rose from 5% of all deaths in 2018 to 19% in 2019. Among male PEHs, the share of alcohol-related deaths increased from 2% to 11%. As a result, although the number of overdose deaths continued to rise, their share of total PEH deaths declined from 34% in 2018 to 29% in 2019. The year 2019 may be considered a tipping point in the overdose crisis, as the number of overdose deaths among total PEHs (115), sheltered (75), non-sheltered (40), male (91), and female (25) nearly matched the long-term averages for each group.
In 2020, total PEH deaths increased by 52%, driven by a 79% rise in deaths among the sheltered population, which rose from 404 to 613. Deaths among non-sheltered PEHs increased by 4%, from 148 to 154. Overdose deaths among sheltered PEHs increased by 25%, from 75 to 100, and among male PEHs by 14%. However, overdose deaths among non-sheltered PEHs declined by 23%, from 40 to 31.
Despite these changes, the proportion of overdose deaths to total deaths among PEHs and their subgroups declined due to the emergence of COVID-19 as a major cause of death. In 2020, the leading causes of death among PEHs were more evenly distributed: overdose accounted for 21%, COVID-19 for 20%, and heart disease for 17%. The sheltered population was more adversely affected by COVID-19 than the non-sheltered population, with COVID-19 accounting for 24% of sheltered deaths compared to 8% of non-sheltered deaths. This shift resulted in the lowest recorded share of overdose deaths among PEHs in the study period.
Between 2021 and 2022, overdose deaths and their proportional mortality rates increased sharply among sheltered, non-sheltered, and male PEHs. In both years, overdose deaths remained concentrated in the sheltered population, where they accounted for more than one-third of all PEH deaths.
In 2023, a dramatic shift occurred. Overdose deaths among sheltered PEHs declined by 23%, while deaths among non-sheltered PEHs surged by 156%. This trend continued in 2024, with overdose deaths among sheltered PEHs declining by another 18%, while deaths among non-sheltered PEHs stabilized, increasing by just 2%.
Throughout this period, overdose deaths among male PEHs remained high, contributing to approximately 40% of all PEH deaths since 2022.
| Year | Deaths (25-44) | % total | YoY change | Deaths (45-64) | %total | YoY change | Deaths (65+) | % total | YoY inc |
| FY 2006 | 46 | 28.40% | 85 | 52.47% | 13 | 8% | |||
| FY 2007 | 31 | 24.80% | -32.61% | 71 | 56.80% | -16.47% | 8 | 6% | -38.46% |
| FY 2008 | 49 | 25.79% | 58.06% | 101 | 53.16% | 42.25% | 26 | 14% | 225.00% |
| FY 2009 | 48 | 27.12% | -2.04% | 94 | 53.11% | -6.93% | 19 | 11% | -26.92% |
| FY 2010 | 52 | 27.37% | 8.33% | 104 | 54.74% | 10.64% | 15 | 8% | -21.05% |
| FY 2011 | 37 | 23.57% | -28.85% | 89 | 56.69% | -14.42% | 16 | 10% | 6.67% |
| FY 2012 | 44 | 25.88% | 18.92% | 105 | 61.76% | 17.98% | 15 | 9% | -6.25% |
| FY 2013 | 49 | 23.56% | 11.36% | 119 | 57.21% | 13.33% | 25 | 12% | 66.67% |
| FY 2014 | 56 | 26.29% | 14.29% | 127 | 59.62% | 6.72% | 16 | 8% | -36.00% |
| FY 2015 | 46 | 21.70% | -17.86% | 116 | 54.72% | -8.66% | 32 | 15% | 100.00% |
| FY 2016 | 51 | 21.34% | 10.87% | 138 | 57.74% | 18.97% | 34 | 14% | 6.25% |
| FY 2017 | 79 | 25.40% | 54.90% | 188 | 60.45% | 36.23% | 27 | 9% | -20.59% |
| FY 2018 | 93 | 32.07% | 17.72% | 157 | 54.14% | -16.49% | 29 | 10% | 7.41% |
| FY 2019 | 105 | 25.99% | 12.90% | 219 | 54.21% | 39.49% | 50 | 12% | 72.41% |
| FY 2020 | 155 | 25.29% | 47.62% | 330 | 53.83% | 50.68% | 106 | 17% | 112.00% |
| FY 2021 | 180 | 28.13% | 16.13% | 354 | 55.31% | 7.27% | 77 | 12% | -27.36% |
| FY 2022 | 205 | 29.97% | 13.89% | 372 | 54.39% | 5.08% | 84 | 12% | 9.09% |
| FY 2023 | 242 | 32.97% | 18.05% | 355 | 48.37% | -4.57% | 89 | 12% | 5.95% |
| FY 2024 | 233 | 30.26% | -3.72% | 394 | 51.17% | 10.99% | 98 | 13% | 10.11% |
| 1801 | 28% | 3518 | 54% | 779 | 12% |
Source: New York City Department of Health and Mental Hygiene (DOHMH) & Department of Homeless Services (DHS) Annual Reports on Homeless Deaths (FY06-FY24)
While it is not possible to directly identify which age groups were most affected by overdose deaths, we can make some inferences based on available data (see table). From 2006 to 2024, proportional mortality rates by age group have remained relatively stable among individuals aged 25–44, 45–64, and 65 and older. However, notable year-over-year increases in deaths within specific age groups may reflect the influence of dominant causes of death during those periods.
For example, individuals in the 25–44 and 45–64 age cohorts appear to have been more affected by overdose deaths in 2017, when overdose mortality spiked across the PEH population. In contrast, the sharp rise in deaths across all age groups in 2020 was most likely driven by the impact of COVID-19.
Conclusion
Overdose deaths have decisively shaped the overall increase in total deaths among PEHs in New York City. This brief identifies varied impacts across subpopulations – by shelter status and gender – over three time periods. FY2017 marked the onset of the current crisis: overdose became the leading cause of death due to significant increases among sheltered and male PEHs. FY2019 represented a tipping point: overdose deaths across all subgroups approached or matched their long-term averages. Although the absolute number of overdose deaths continued to rise, their proportional share declined due to increases in other causes—particularly alcohol-related and unverifiable deaths. This suggested a broadening of mortality risks even as overdose remained central.
FY2021-22 marked the peak of the crisis. Overdose deaths reached their highest recorded levels, accounting for nearly half of all PEH deaths. The crisis was most acute among male and sheltered PEHs, where overdose deaths contributed to more than one-third of all deaths. These years also saw the highest proportional mortality rates for overdose across the study period.
Works Cited
New York City Department of Health and Mental Hygiene (DOHMH) & Department of Homeless Services (DHS) Annual Reports on Homeless Deaths (FY07-FY25):
- New York City Department of Health and Mental Hygiene & Department of Homeless Services. (2007). First annual report on homeless deaths: July 1, 2005 – June 30, 2006.
- New York City Department of Health and Mental Hygiene & Department of Homeless Services. (2008). Second annual report on homeless deaths: July 1, 2006 – June 30, 2007. https://a860-gpp.nyc.gov/downloads/m326m369h
- New York City Department of Health and Mental Hygiene & Department of Homeless Services. (2009). Third annual report on homeless deaths: July 1, 2007 – June 30, 2008.
- New York City Department of Health and Mental Hygiene & Department of Homeless Services. (2010). Fourth annual report on homeless deaths: July 1, 2008 – June 30, 2009.
- New York City Department of Health and Mental Hygiene & Department of Homeless Services. (2011). Fifth annual report on homeless deaths: July 1, 2009 – June 30, 2010.
- New York City Department of Health and Mental Hygiene & Department of Homeless Services. (2012). Sixth annual report on homeless deaths: July 1, 2010 – June 30, 2011.
- New York City Department of Health and Mental Hygiene & Department of Homeless Services. (2013). Seventh annual report on homeless deaths: July 1, 2011 – June 30, 2012.
- New York City Department of Health and Mental Hygiene & Department of Homeless Services. (2014). Eighth annual report on homeless deaths: July 1, 2012 – June 30, 2013.
- New York City Department of Health and Mental Hygiene & Department of Homeless Services. (2015). Ninth annual report on homeless deaths: July 1, 2013 – June 30, 2014.
- New York City Department of Health and Mental Hygiene & Department of Homeless Services. (2016). Tenth annual report on homeless deaths: July 1, 2014 – June 30, 2015.
- New York City Department of Health and Mental Hygiene & Department of Homeless Services. (2017). Eleventh annual report on homeless deaths: July 1, 2015 – June 30, 2016.
- New York City Department of Health and Mental Hygiene & Department of Homeless Services. (2018). Twelfth annual report on homeless deaths: July 1, 2016 – June 30, 2017.
- New York City Department of Health and Mental Hygiene & Department of Homeless Services. (2019). Thirteenth annual report on homeless deaths: July 1, 2017 – June 30, 2018.
- New York City Department of Health and Mental Hygiene & Department of Homeless Services. (2020). Fourteenth annual report on homeless deaths: July 1, 2018 – June 30, 2019.
- New York City Department of Health and Mental Hygiene & Department of Homeless Services. (2021). Fifteenth annual report on homeless deaths: July 1, 2019 – June 30, 2020.
- New York City Department of Health and Mental Hygiene & Department of Homeless Services. (2022). Sixteenth annual report on homeless deaths: July 1, 2020 – June 30, 2021. https://a860-gpp.nyc.gov/downloads/j9602313t
- New York City Department of Health and Mental Hygiene & Department of Homeless Services. (2023). Seventeenth annual report on homeless deaths: July 1, 2021 – June 30, 2022.
- New York City Department of Health and Mental Hygiene & Department of Homeless Services. (2024). Eighteenth annual report on homeless deaths: July 1, 2022 – June 30, 2023.
- New York City Department of Health and Mental Hygiene & Department of Homeless Services. (2025). Nineteenth annual report on homeless deaths: July 1, 2023 – June 30, 2024.
Other Sources:
New York City Department of Homeless Services. (2022). Homeless Outreach Population Estimate (HOPE): 2022 results. NYC.gov. https://www.nyc.gov/assets/dhs/downloads/pdf/hope/hope-2022-results.pdf
New York City Department of Social Services. (2024, June 13). DSS announces HOPE 2024 survey estimate reflecting effectiveness of city’s response to dual crises. NYC.gov. https://www.nyc.gov/site/dhs/about/press-releases/hope-2024.page
Spauster, P., Nesta, A., & Whitford, E. (n.d.). Homeless Shelter Tracker. City Limits. Retrieved November 7, 2025, from https://citylimits.org/homeless-shelter-tracker/ [citylimits.org]
Acknowledgment
The authors wish to thank Kinsey Dinan, Deputy Commissioner, NYC Department of Social Services (DSS) for making DOHMH/DHS annual reports on homeless deaths available to conduct this analysis.
[1] This co-author interned with HELP USA during the time the study took place.


