By Steve McFeely
In 2024, Help USA staff placed 1,323 clients into housing—a 6.2% increase compared to 1,246 placements in 2023. This growth occurred despite only a 1.7% increase in the average number of beds/units available in 2024.
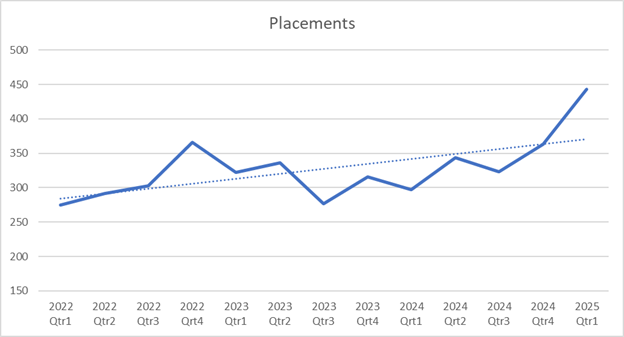
Comparing Q1 2024 to Q1 2025, placements rose from 297 to 443, marking a 49% increase. When normalized by daily placement rate and average beds/units, the Q1 2025 placement rate was 32% higher than the calendar year 2024 average.
At sites in New York under the Human Resource Administration (HRA), as well as in Las Vegas and Philadelphia, placements declined by 21.7%—from 327 in 2023 to 256 in 2024. This drop occurred despite only an 8.5% reduction in average beds/units, primarily due to the conversion of Philadelphia II to permanent housing. However, Q1 placements at these sites increased from 64 in 2024 to 79 in 2025, a 23% year-over-year rise. The normalized placement rate for Q1 2025 was 36% higher than in Q1 2024.
In contrast, New York City sites under the Department of Homeless Services (DHS) saw a 16.1% increase in placements—from 919 in 2023 to 1,067 in 2024—even though placements at assessment sites declined from 93 to 68. DHS sites experienced only a modest 3.5% increase in average beds/units. Q1 placements at DHS sites rose from 233 in 2024 to 364 in 2025, a 56% increase. The normalized placement rate per day per bed/unit at DHS sites was 32% higher in Q1 2025 compared to calendar year 2024.
Despite the conversion of Philadelphia II to permanent housing on June 1, 2024, overall placements during the study period increased by 8.2%—from 1,215 in 2023 to 1,315 in 2024. Q1 placements rose 51% year-over-year, from 293 in 2024 to 443 in 2025, with a corresponding 32% increase in the normalized placement rate.
Excluding assessment and sanctuary sites—which serve as system entry points and asylum seeker support centers—HelpUSA placements increased by 7.7%, from 1,117 in 2023 to 1,203 in 2024. Q1 placements rose from 269 in 2024 to 373 in 2025, a 36% increase, while the normalized placement rate grew by 27%.
Focusing solely on DHS facilities (excluding assessment and sanctuary sites), placements increased by 16.3%, from 821 in 2023 to 955 in 2024. Q1 placements rose 41% year-over-year, from 209 in 2024 to 294 in 2025. The normalized placement rate per day per bed/unit increased by 25% in Q1 2025 compared to calendar year 2024.
Subsidized vs. Unsubsidized Placement Trends
HelpUSA observed distinct trends in subsidized and unsubsidized housing placements. A subsidized placement refers to a housing placement made possible through a public rental subsidy or voucher.
Subsidized Placements
Subsidized placements increased significantly across HelpUSA sites:
- Total placements rose from 813 in 2023 to 973 in 2024—a 20% increase.
- Q1 placements increased from 212 in 2024 to 303 in 2025—a 43% year-over-year increase.
- The normalized placement rate (adjusted for time and average beds/units) rose 23% in Q1 2025 compared to calendar year 2024.
At non-DHS sites, subsidized placements declined slightly:
- From 173 in 2023 to 168 in 2024—a 3% decrease, largely due to the conversion of Philadelphia II and fewer placements at New York shelters.
- However, Q1 placements increased from 45 in 2024 to 53 in 2025—an 18% increase.
- The normalized placement rate at non-DHS sites rose 36% from 2024 to Q1 2025.
At DHS sites, subsidized placements increased:
- From 640 in 2023 to 805 in 2024—a 26% increase.
- Q1 placements rose from 167 in 2024 to 250 in 2025—a 50% increase.
- The normalized placement rate increased 20% in Q1 2025 compared to calendar year 2024.
Unsubsidized Placements
Unsubsidized placements showed a different pattern:
- Total placements decreased by 18%, from 420 in 2023 to 346 in 2024.
- However, Q1 placements rose sharply from 87 in 2024 to 140 in 2025—a 61% increase.
- The normalized placement rate increased 59% from calendar year 2024 to Q1 2025.
At DHS sites:
- Unsubsidized placements declined slightly from 279 in 2023 to 264 in 2024.
- Q1 placements increased from 68 in 2024 to 114 in 2025—a 68% increase.
- The normalized placement rate rose 67% from 2024 to Q1 2025.
At non-DHS sites:
- Unsubsidized placements dropped by 42%, from 141 in 2023 to 82 in 2024.
- Q1 placements increased from 19 in 2024 to 26 in 2025—a 37% increase.
- The normalized placement rate rose 36% from 2024 to Q1 2025.
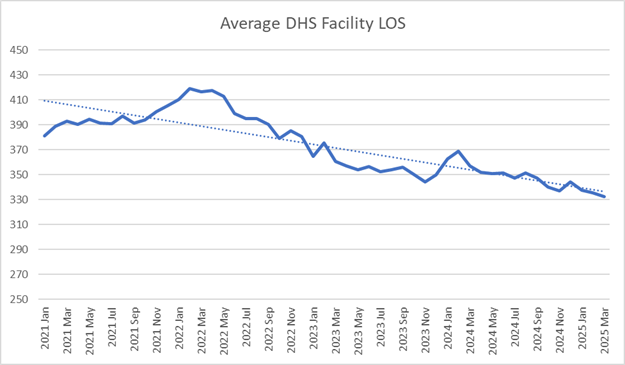
The emphasis on placing long-term stayers has contributed to a reduction in the average length of stay for HelpUSA clients. When excluding assessment sites, sanctuary sites, and locations that have closed, the average length of stay at DHS sites decreased from a peak of 419.24 days in February 2022 to 332.22 days in March 2025—a 21% reduction.
A notable subset of housing voucher applications involves the New York City Housing Authority (NYCHA) Section 8 Program. NYCHA briefly reopened its Section 8 waiting list in early June 2024 but stopped accepting new applications on June 9. HelpUSA clients continue to receive responses to applications submitted during that window. Since then, 17 placements have been made using Section 8 vouchers—9 from Families with Children sites and 8 from Single Adult sites.